Lessons From Underclocking an S19J Pro
A Glimpse Into the Cockroach Mindset
Over the course of Q4 2022 and Q1 2023, Isaac Fithian (Chief Field Operations & Manufacturing Officer) and Rete Browning (Chief Technology Officer) put Bitmain’s popular S19J Pro through its paces to see what the machine is capable of. We used our findings to optimize fleet performance and generate the maximum cash flow from each of our sites based on the constraints and conditions at each, during some of the worst mining conditions ever experienced.
The below was originally published as a tweet thread on February 10, 2023 to provide a glimpse into our process. Our thinking has continued to evolve, but as mining conditions deteriorate once more, we believe these lessons are more relevant than ever.
For this analysis, we used a S19J Pro 96T and focused only on underclocking the machine. Different operating environments will produce different results, but we used a water-cooled setup to better control the measurement temperature band. We then corroborated our findings using air-cooled machines in normal operating environments (as you will read below, the ambient temperature can have a large impact on achieved efficiencies). Let us begin.
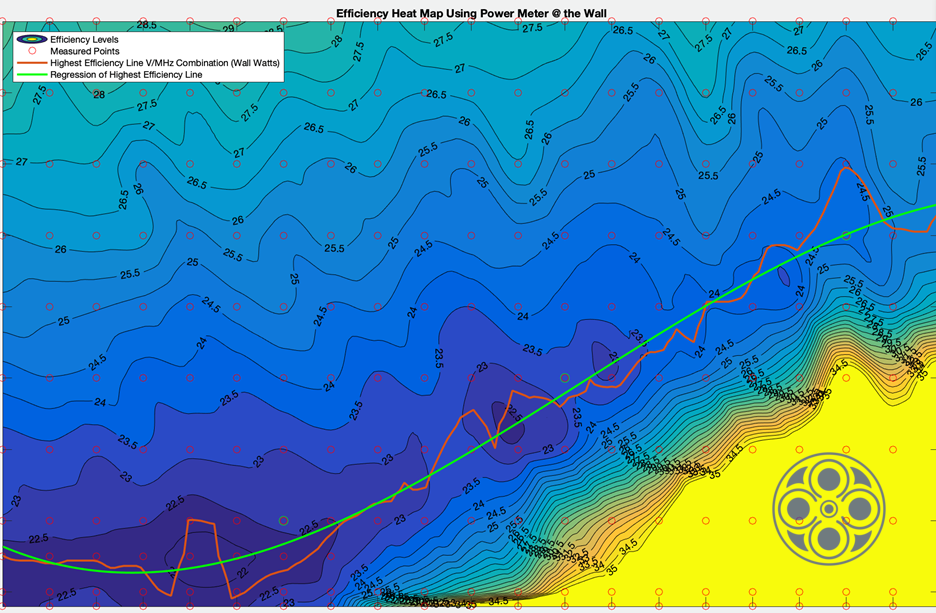
We tested different voltage/frequency combinations in a grid pattern. In Figure 1, the red circles represent each of the test points, the X-axis is frequency, and the Y-axis is chip voltage. The resulting “heat map” or contours are the achieved efficiency levels, as measured by joules per terahash (J/TH). The dark purple regions mark the highest efficiency (lowest J/TH) and the bright yellow regions mark the lowest efficiency (the highest J/TH). The orange and yellow lines are the interpolated points of highest efficiency for each voltage/frequency combination. The orange line uses the watts measured at the plug (and all power draw from auxiliary systems) as the basis of calculation and the green line is the line of best fit. The contours were calculated using the plug watts.
There are certain pockets where sub-22 J/TH performance has been achieved. Achieving this efficiency is only possible by underclocking machines, reducing the power draw and thereby reducing the hash rate. This drop in hash rate is inevitable; however, the drop in power draw is disproportionately larger, which equates to more efficient utilization of the power being drawn.
Figure 2 below shows the achieved efficiencies at different frequencies (and corresponding maximum efficiency volt setting at each frequency). The X-axis displays various frequencies and the Y-axis shows the achieved J/TH. The purple line is the is the raw results using the power draw measured at the plug plug and the yellow line is using the estimated power draw from the firmware dashboard. The orange and blue lines are the polynomial regressions of the raw data.
A few observations:
First, the dashboard under-reports the power draw of the machine. On average, the dashboard watts, using the stock power supply unit, is ~5% lower than the measured power across the different voltage/frequency combinations (with some exceptions).
Second, there is a point of diminishing returns beyond which further decrease in frequency becomes counterproductive (i.e., less efficient).
Lastly, this particular S19J Pro seems to have certain voltage/frequency combinations it likes better than others. We find pockets of outperformance wherever efficiency falls below the trendline; the machine performs disproportionately better at these settings.
It is important to capture the nuance of the machine and its capabilities, but there are good general heuristics one can follow to achieve one’s desired result. For example, at a given frequency, there is an expected hash rate that the miner is capable of operating at. The following Figure 3 shows the results of the recorded hash rate/expected hash rate. The X-axis is frequency, Y-axis is voltage, and the contours are the resulting fractions of the recorded hash rate/expected hash rate at a given frequency. The blue line is the highest achieved efficiency line:
Generally, the best performance line follows the channel along the 99% of expected hash rate contour at each frequency. This indicates that there should be enough chip voltage applied so that 99% of the expected hash rate is achieved. Anything above that combination doesn’t yield any notably higher hash rate, but the power draw will continue to increase as chip voltage is changed.
There are a few ways to zero in on how one should operate their machines: namely, deciding which operational variables to prioritize—hash rate, power draw, or efficiency. Ordering those by importance will help develop the right strategy. This all depends on whether one is constrained on number of machines available, power, rack space, or operating cost.
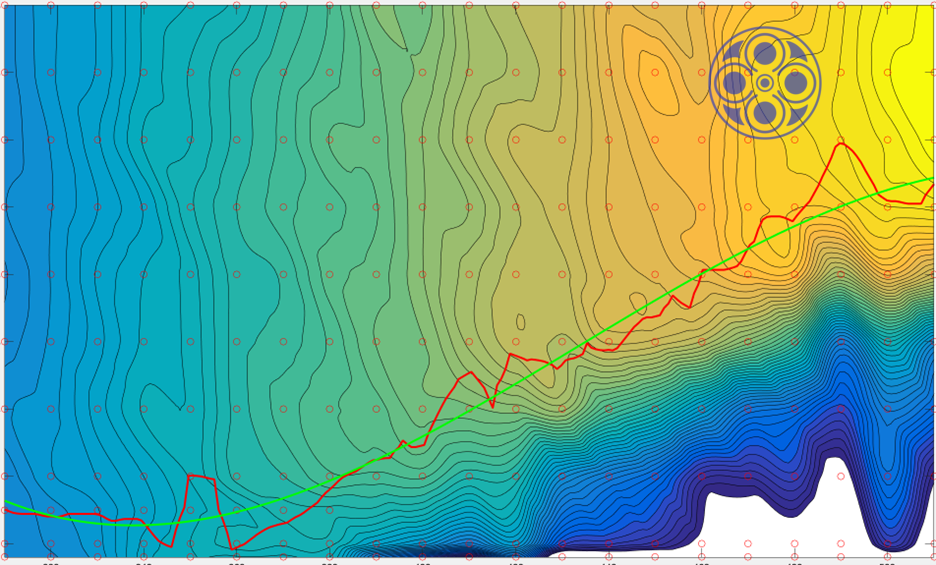
Figure 4 notes the hash rate as the contours in 1 TH increments where the X-Y axis are the same as above:
Similarly, the following Figure 5 shows the power draw in 25-Watt increments at each voltage/frequency combination:
In Figure 4, the hash rate contours are relatively vertical. This follows the observation that certain frequencies are expected to produce a certain TH. The bottom-right hand corner of Figure 4 exhibits that the hash rate becomes highly unstable and erratic if there isn’t sufficient chip voltage applied. In Figure 5, the power contours are diagonal. These two graphs combine to create Figure 1 (J/TH contours) in this series.
Lastly, there is one more variable to discuss—temperature. More specifically, board/chip temperature. The following Figure 6 shows the effects of temperature on the efficiency of the machine. The X-axis is noted chip temperature (C) and the Y-axis is the efficiency recorded at that temperature (J/TH). The three lines are measurements at three different frequencies (and associated maximum efficiency voltage). The blue line is the highest frequency in the series and the yellow line is the lowest. These points are highlighted in Figure 1 with green circles.
We observe that reducing chip temperatures is beneficial—up to a point. Lowering chip temperature to ~40C lowers the measured watt draw of the machine without affecting hash rate stability. However, below ~40C (or board temp of ~25C), the marginal power draw drop flattens and hash rate becomes unstable and erratic. As a result, the efficiency at the same voltage/frequency combination goes down. That said, by regulating the temperature down to this ~40C threshold, the operating efficiency of the machine can increase by 3-4 J/TH. Maintaining such low temperatures, however, becomes exponentially harder and generally results in higher capex to achieve consistently.
Measurements in each of the preceding graphs were taken at 45C (+/- 2.5C). The vertical line at 45C would be the J/TH plane exhibited (rotated 90 degrees to the side) in Figure 1. The original heat map efficiency contours would change if the measurement temperatures were to change. This illustrates the effects and importance of temperature management. It is also important to note that these results are dependent on the machine itself, the operating conditions, and machine type (e.g. S19, S19J, S19J Pro, S19 Pro, etc.).
We hope to have more news to share relating to firmware and our underclocking efforts in the near future. Until then: together, we win.


